

Access real-time reports and insights on inventory, consumption, variances, and costs for better decision-making.
Book a demoHow it works
Every report is built from the stocktakes, recipes, sales and purchases you're already capturing across the other three pages.
Theoretical usage vs. actual usage shows exactly where over-pouring, spillage or loss hides.
Valuation, Dead Stock, Excise Book, Menu Engineering and more, scheduled straight to an owner's inbox.
13
Reports, generated from the same stocktake and sales data you're already capturing, no separate reconciliation step, no spreadsheet stitched together the night before an audit.
Shows exactly what you spent on stock, by category and by bottle, over any period.
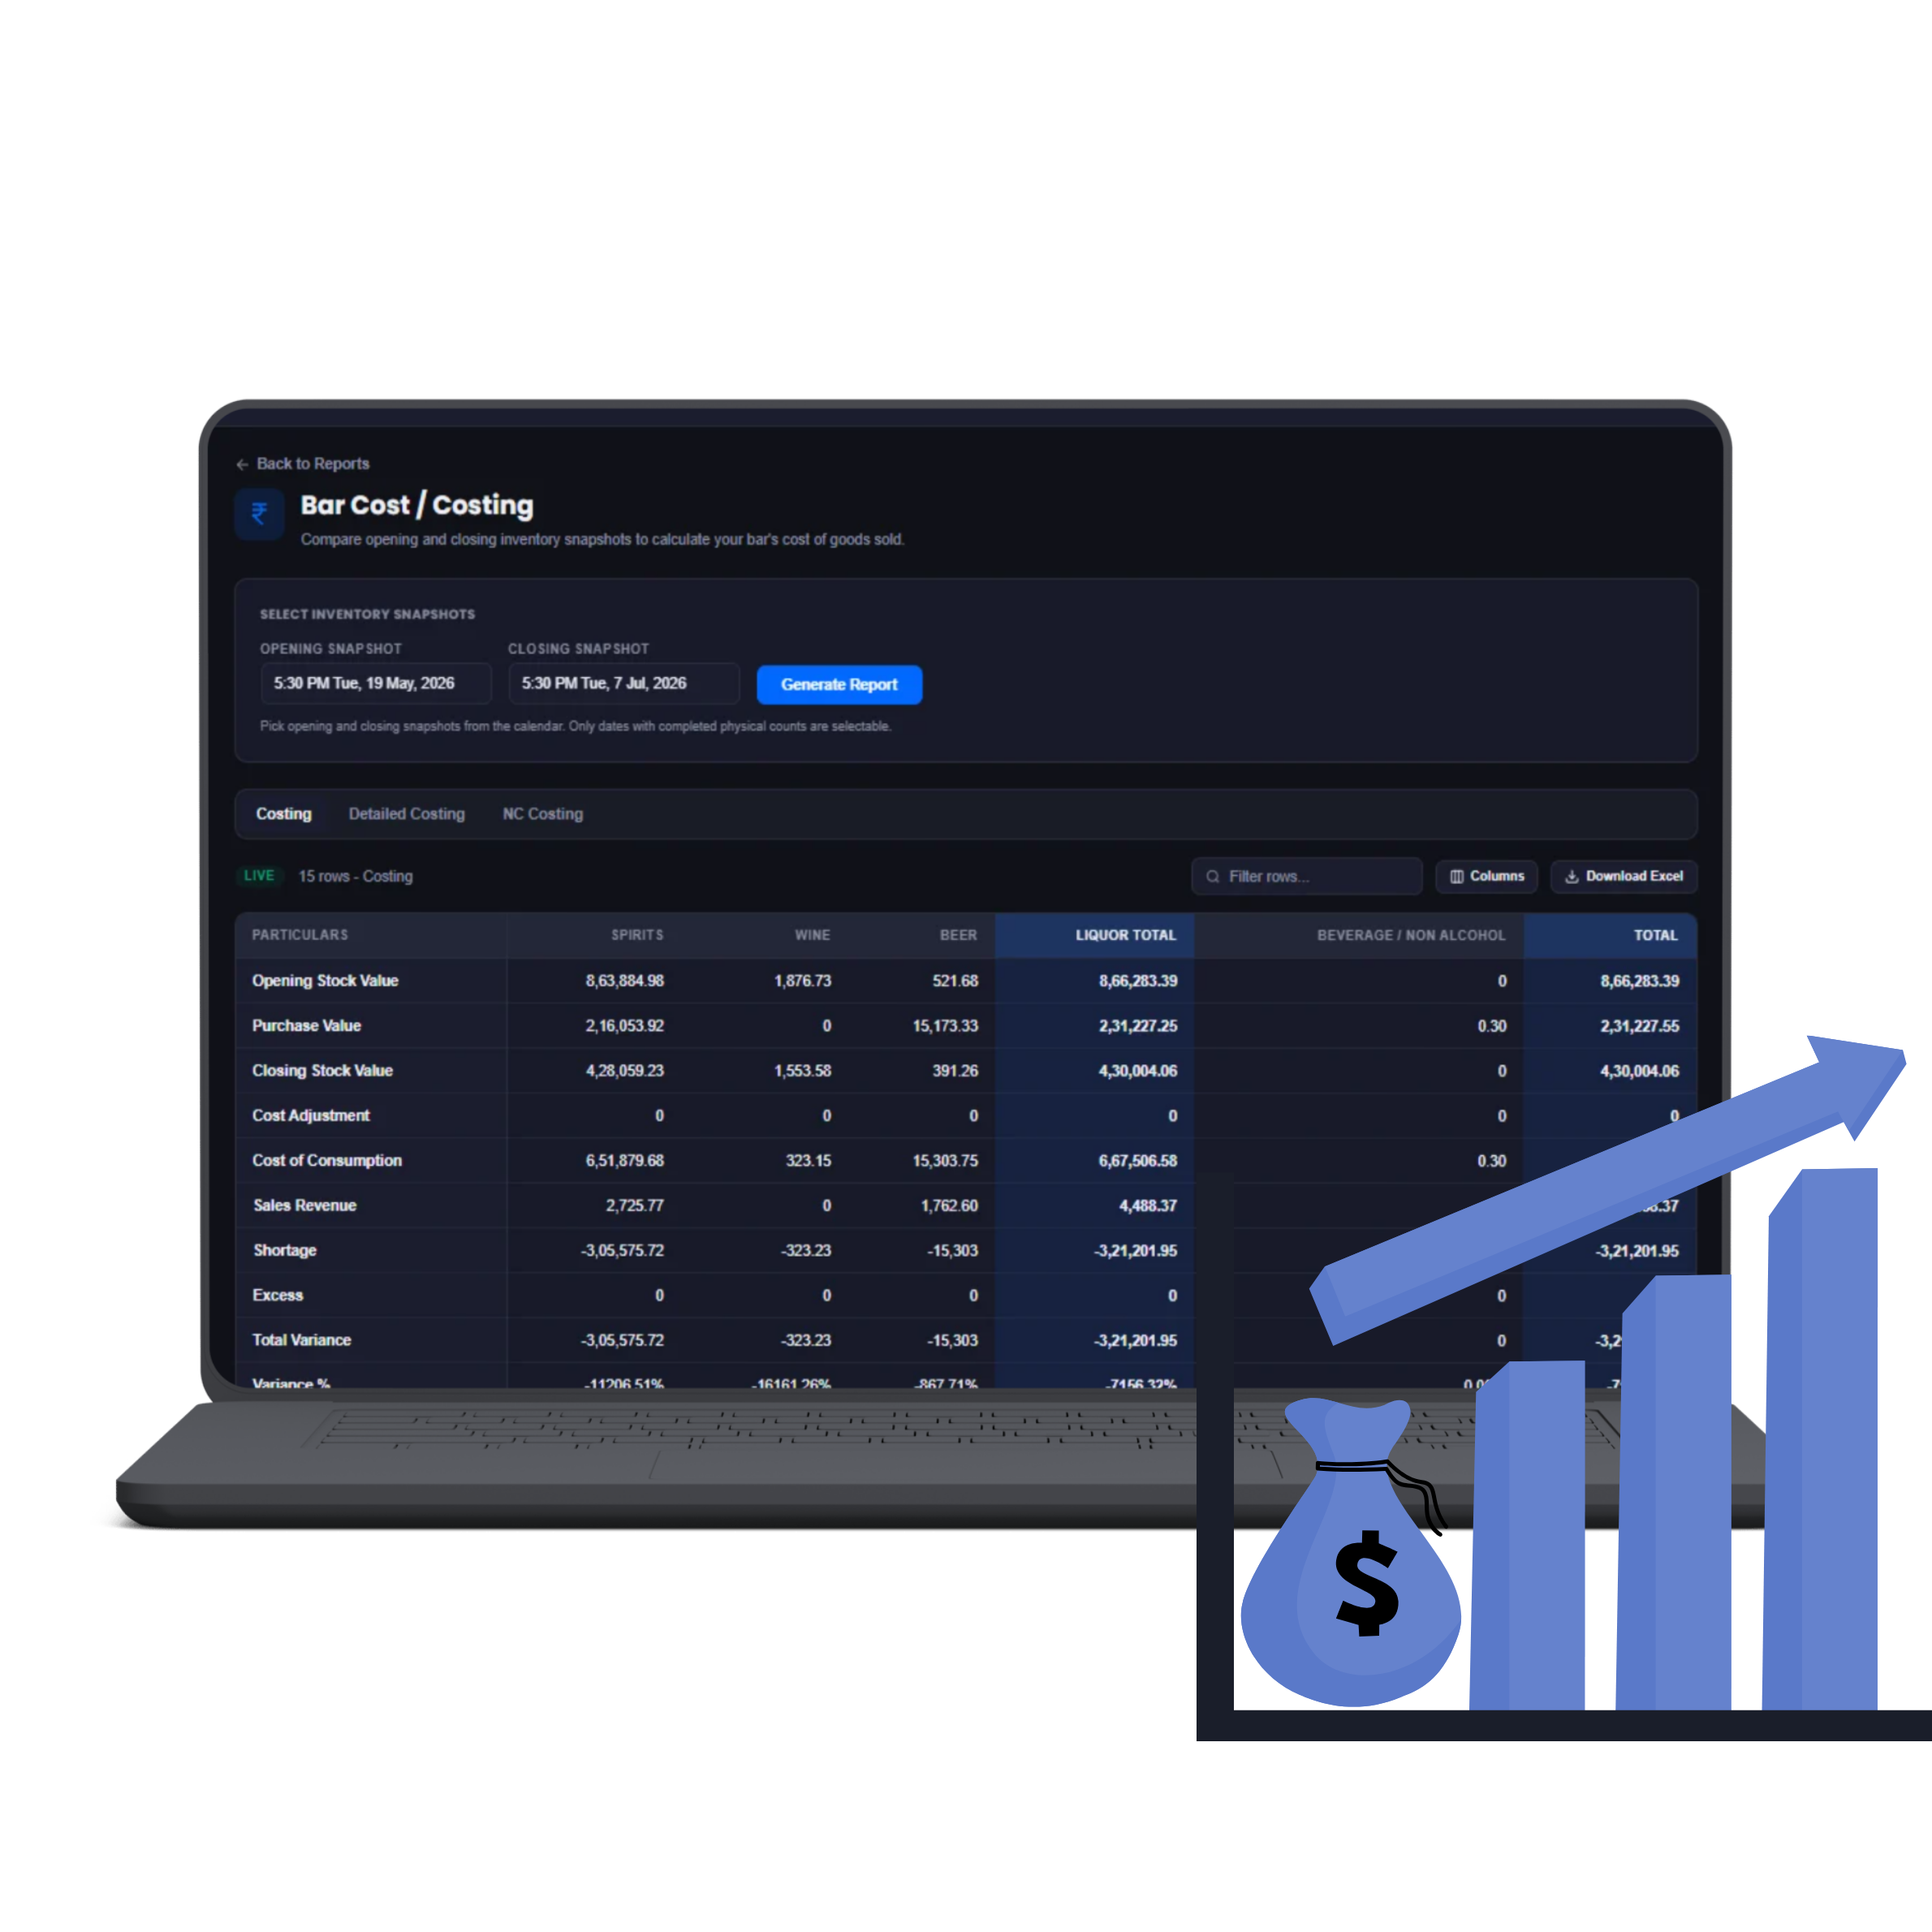
Theoretical usage (recipes + POS sales) vs. actual usage (stocktakes): loss from over-pouring or spillage shows up as a number, not a hunch. Variance = actual usage − theoretical usage − logged adjustments; a positive, unexplained gap left after adjustments is the real red flag, and the single most important number for protecting margin.
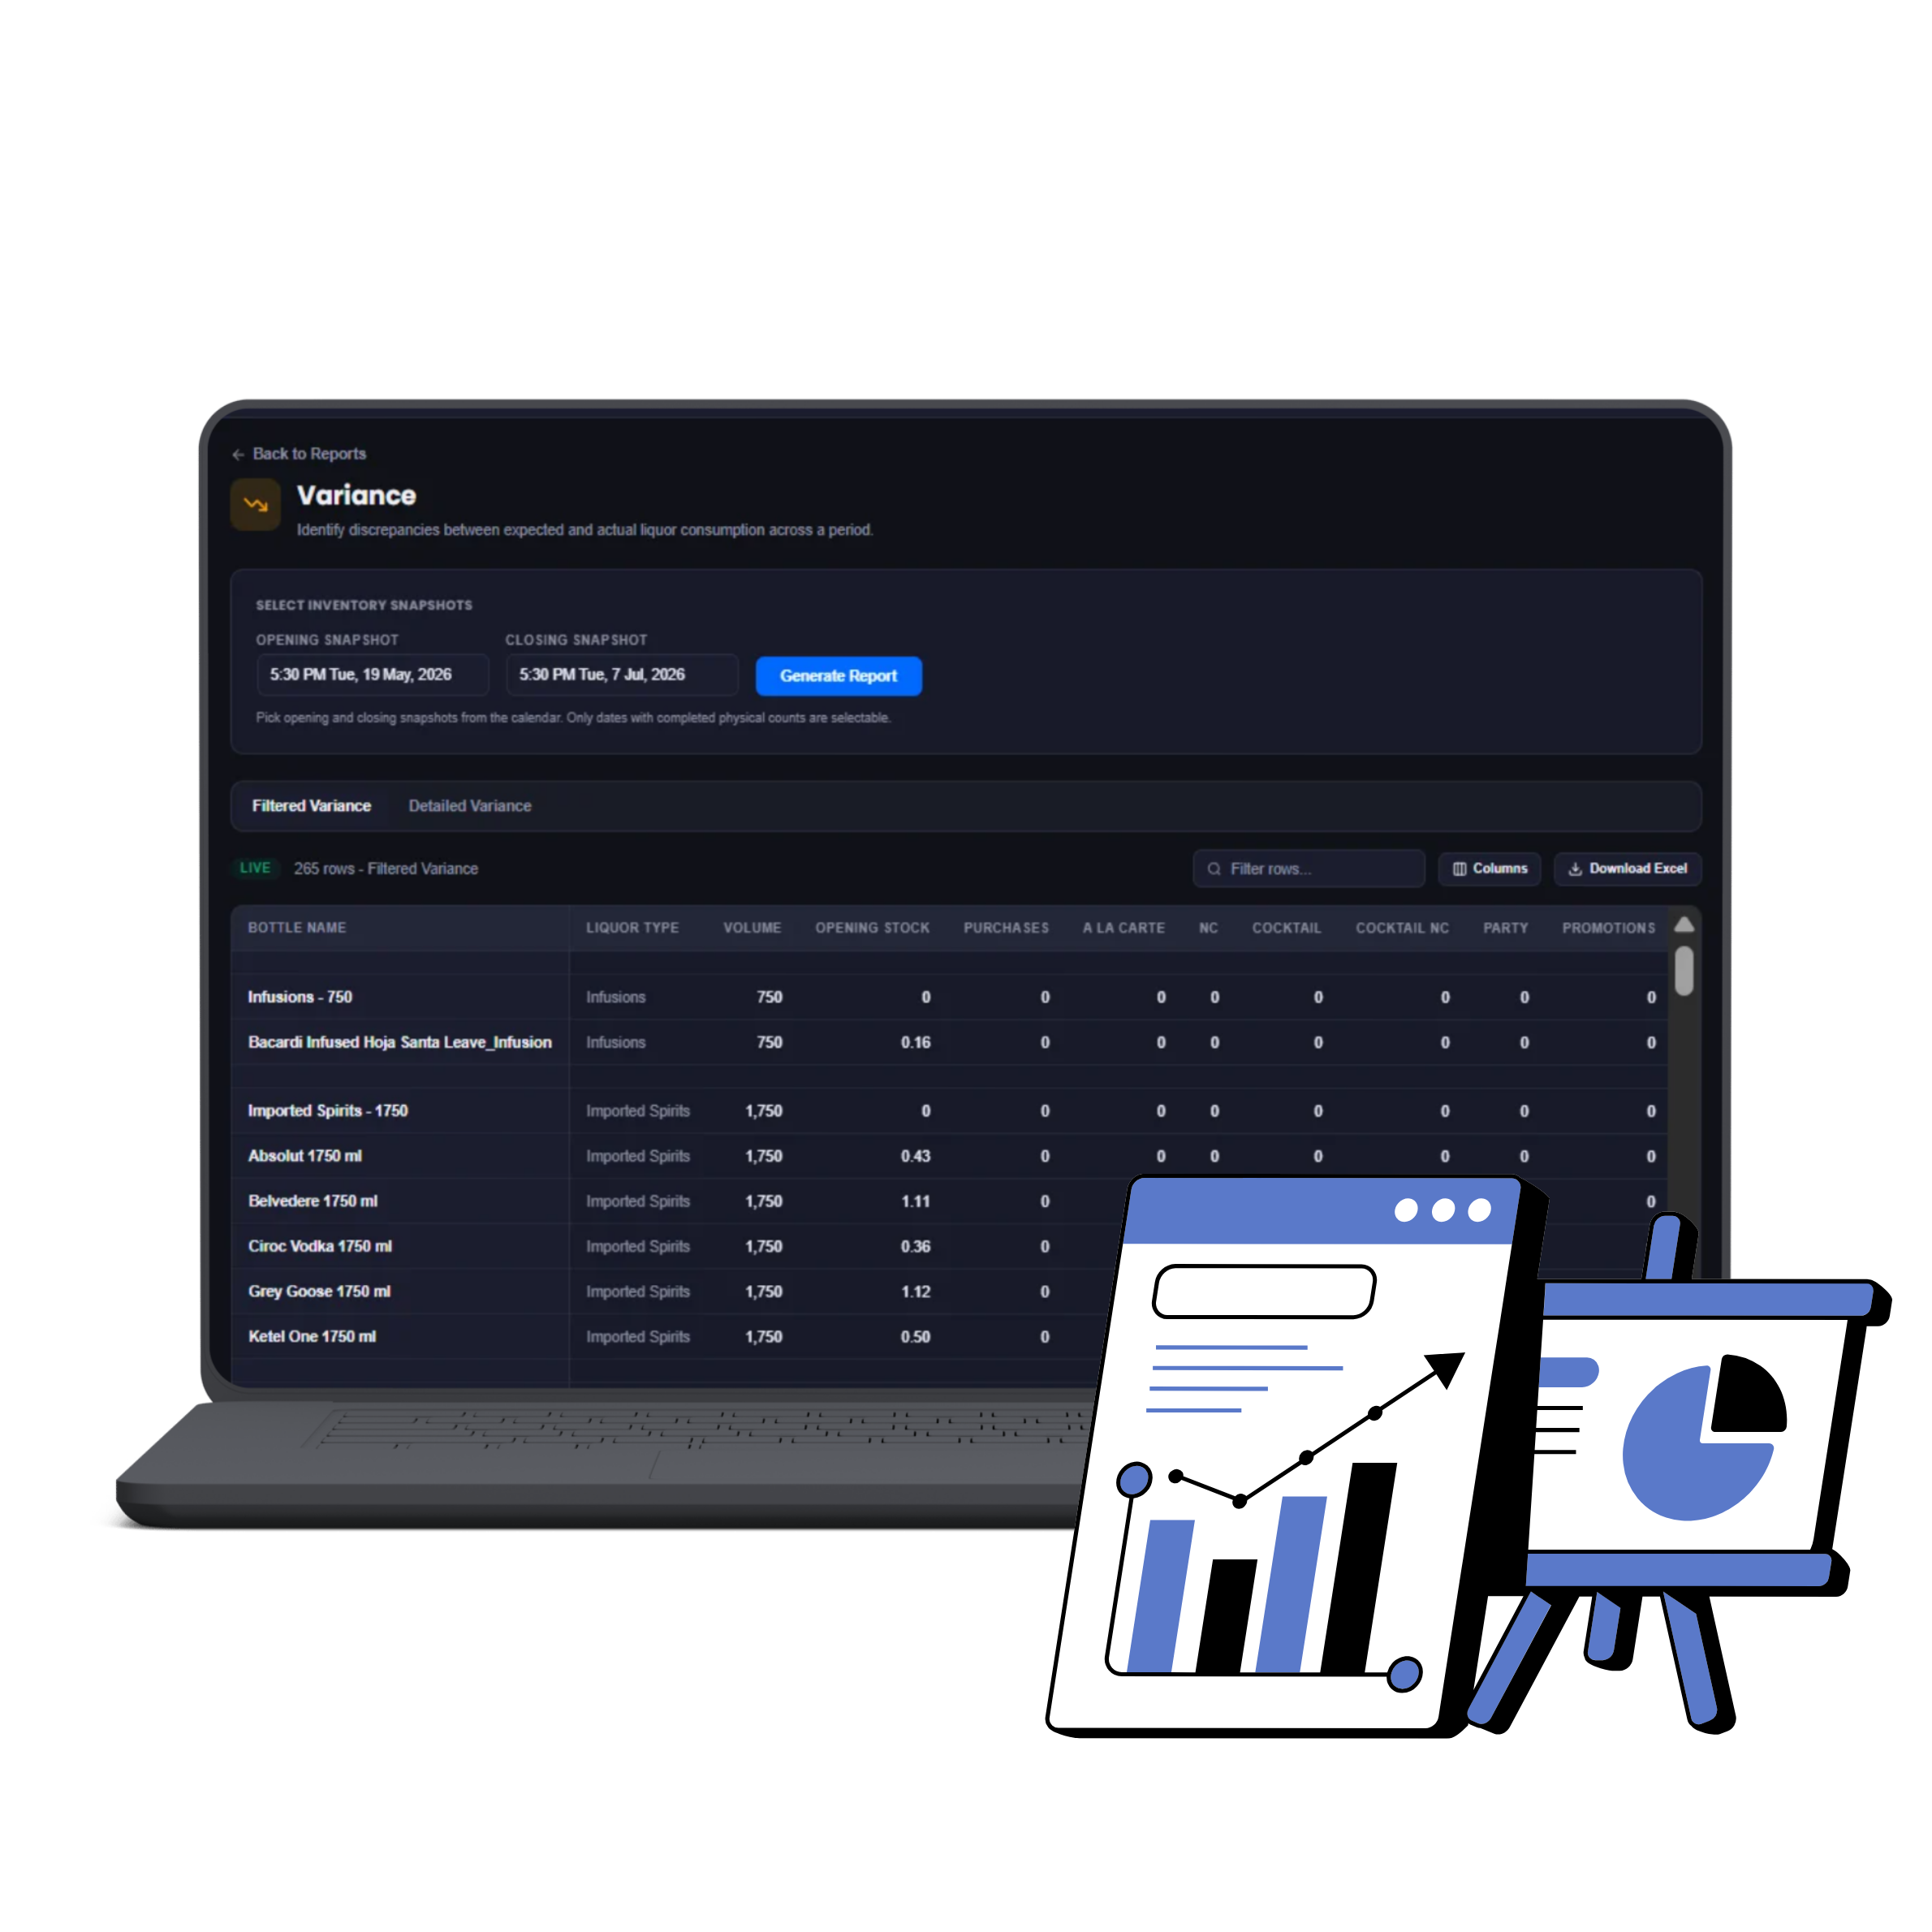
See which drinks are genuinely profitable per serve, the best-seller and the most-profitable item are often not the same drink. A “popular” drink can quietly be a low-margin one, this is how you decide what to actually promote, reprice, or drop from the menu, instead of going on sales count alone.
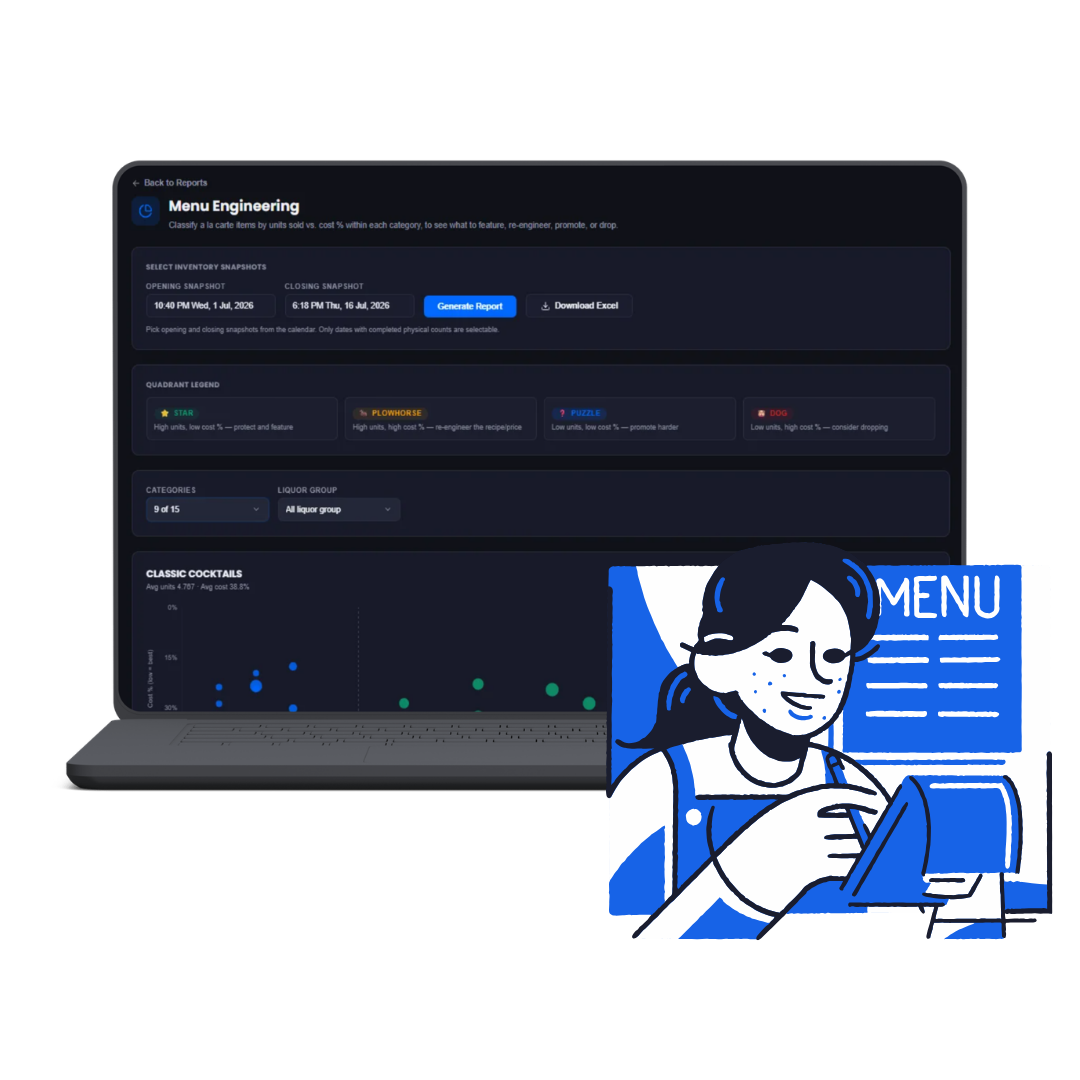
Flags bottles that haven't moved, so cash isn't sitting on a shelf without anyone noticing. Dead stock is cash that's stopped working for you, catching it early means a targeted promotion or return, instead of a stale bottle discovered a year later at the next full audit.
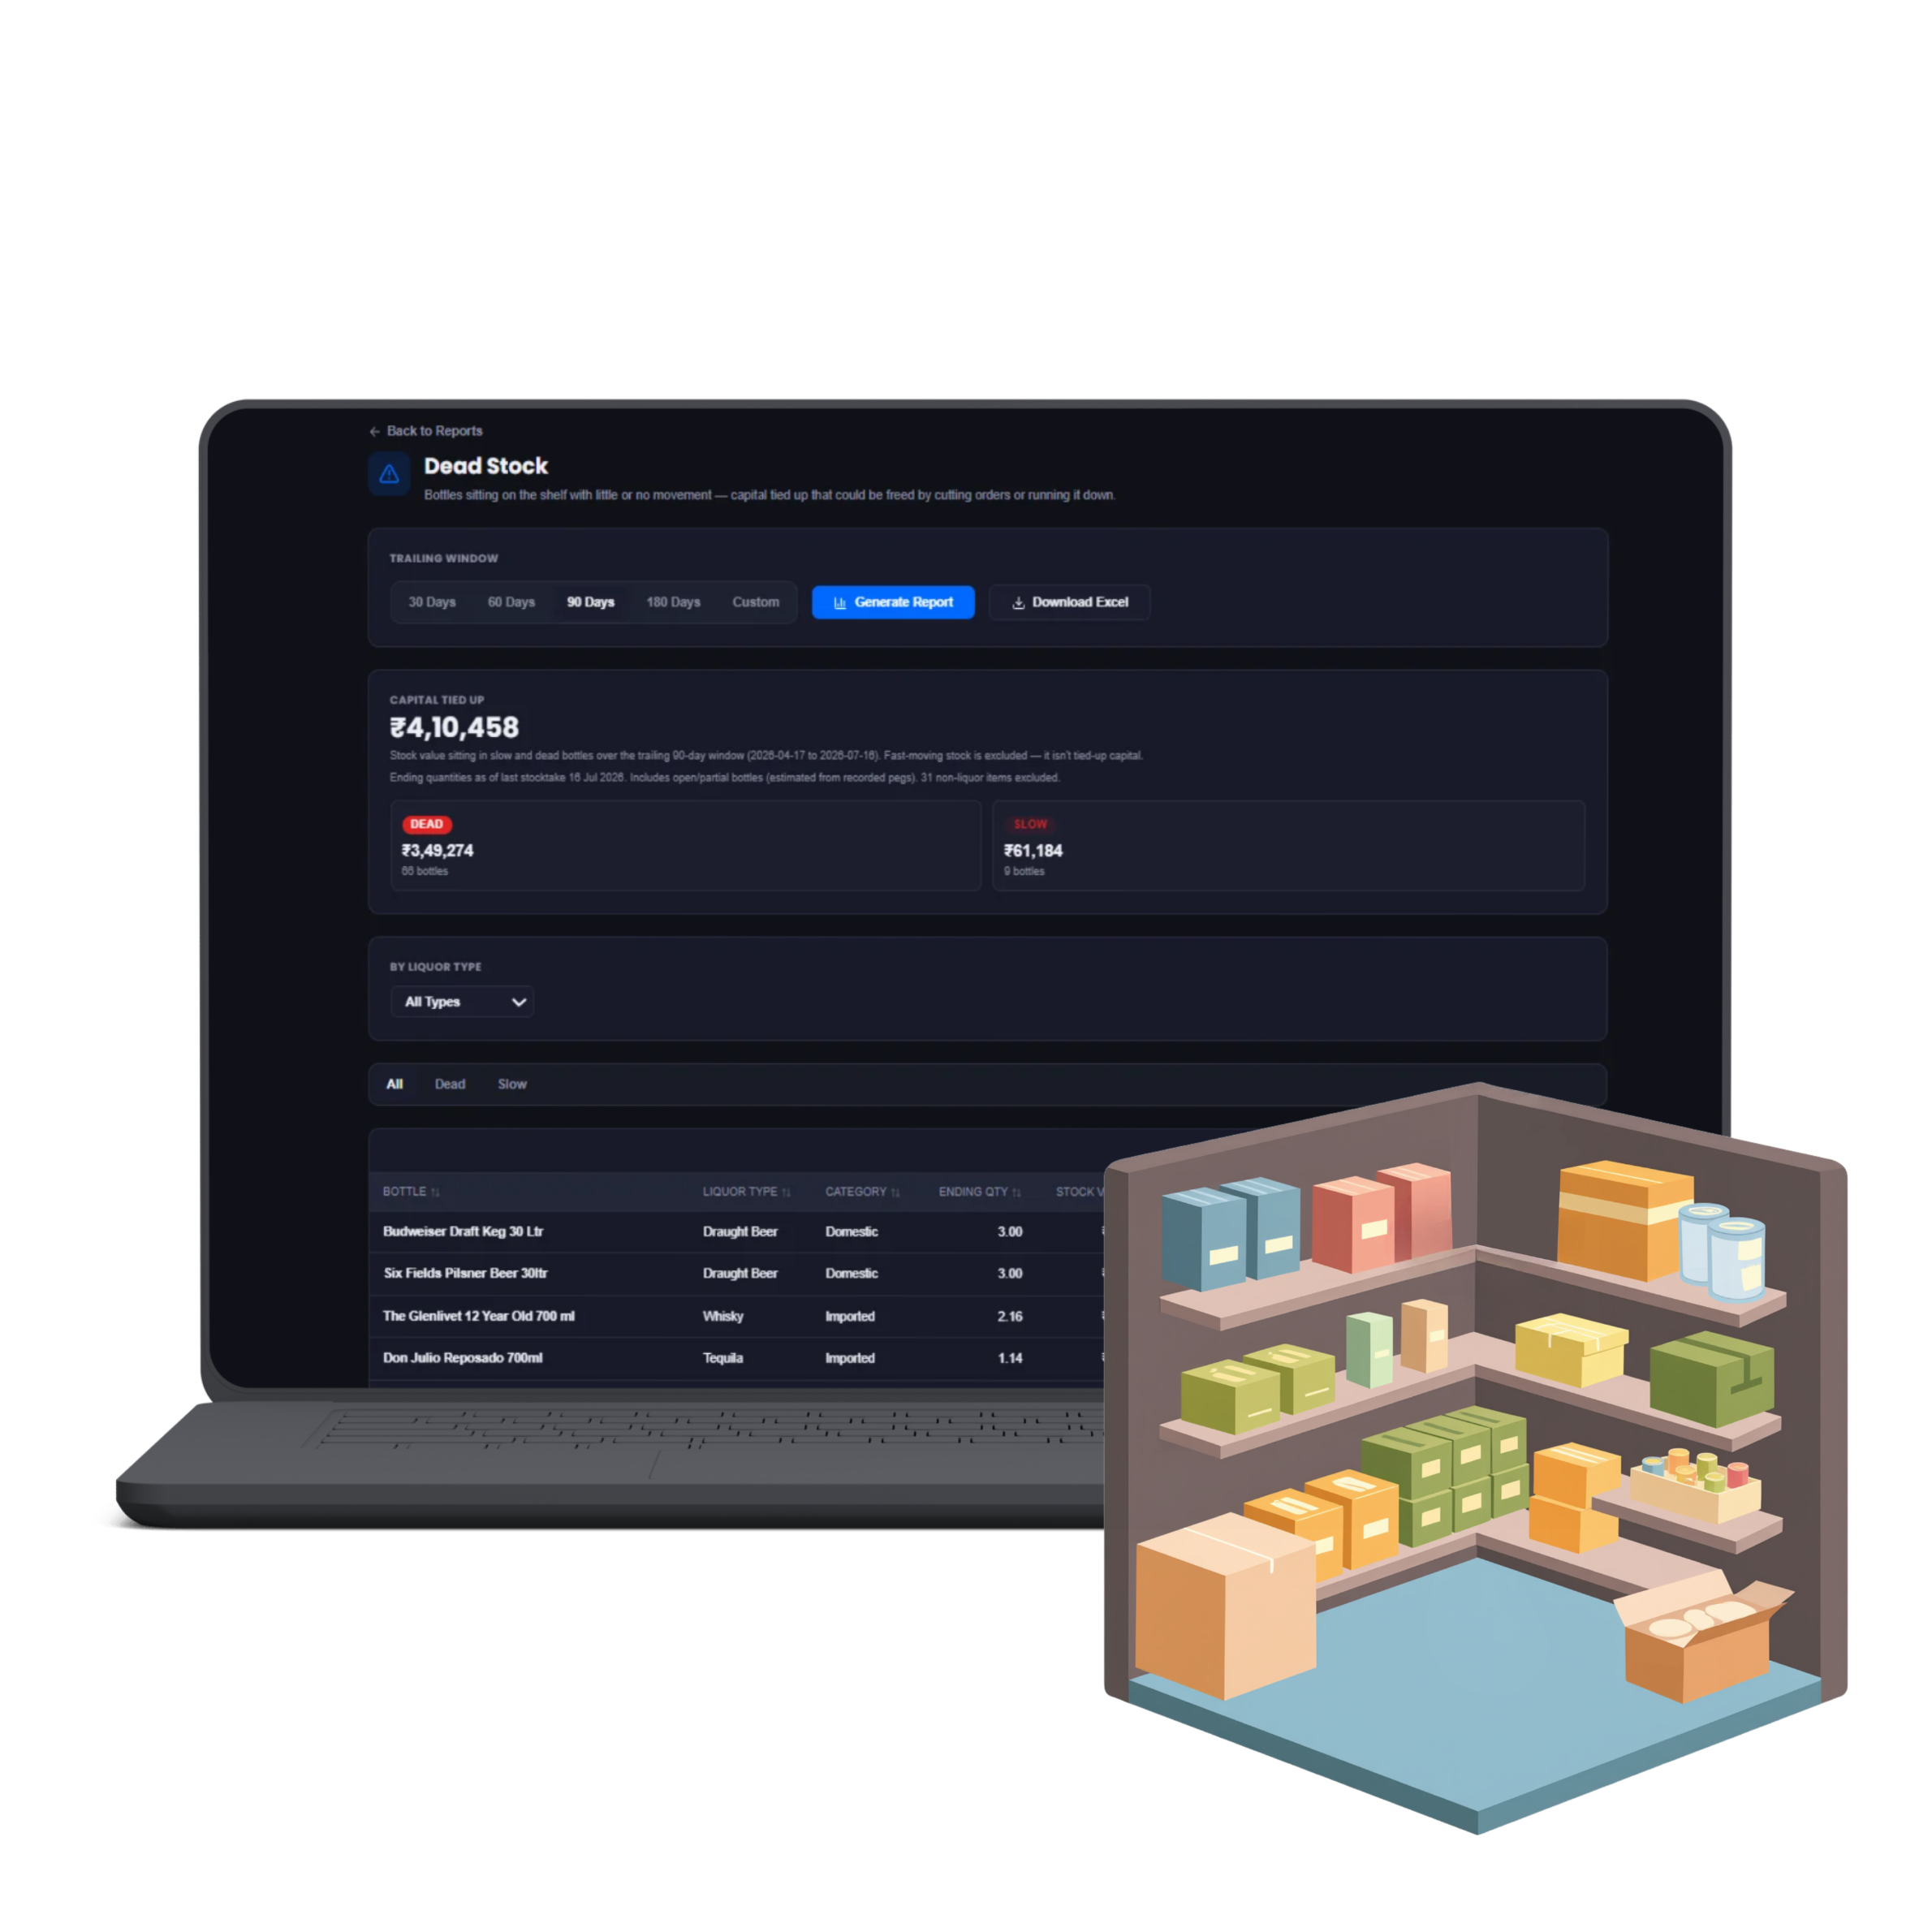
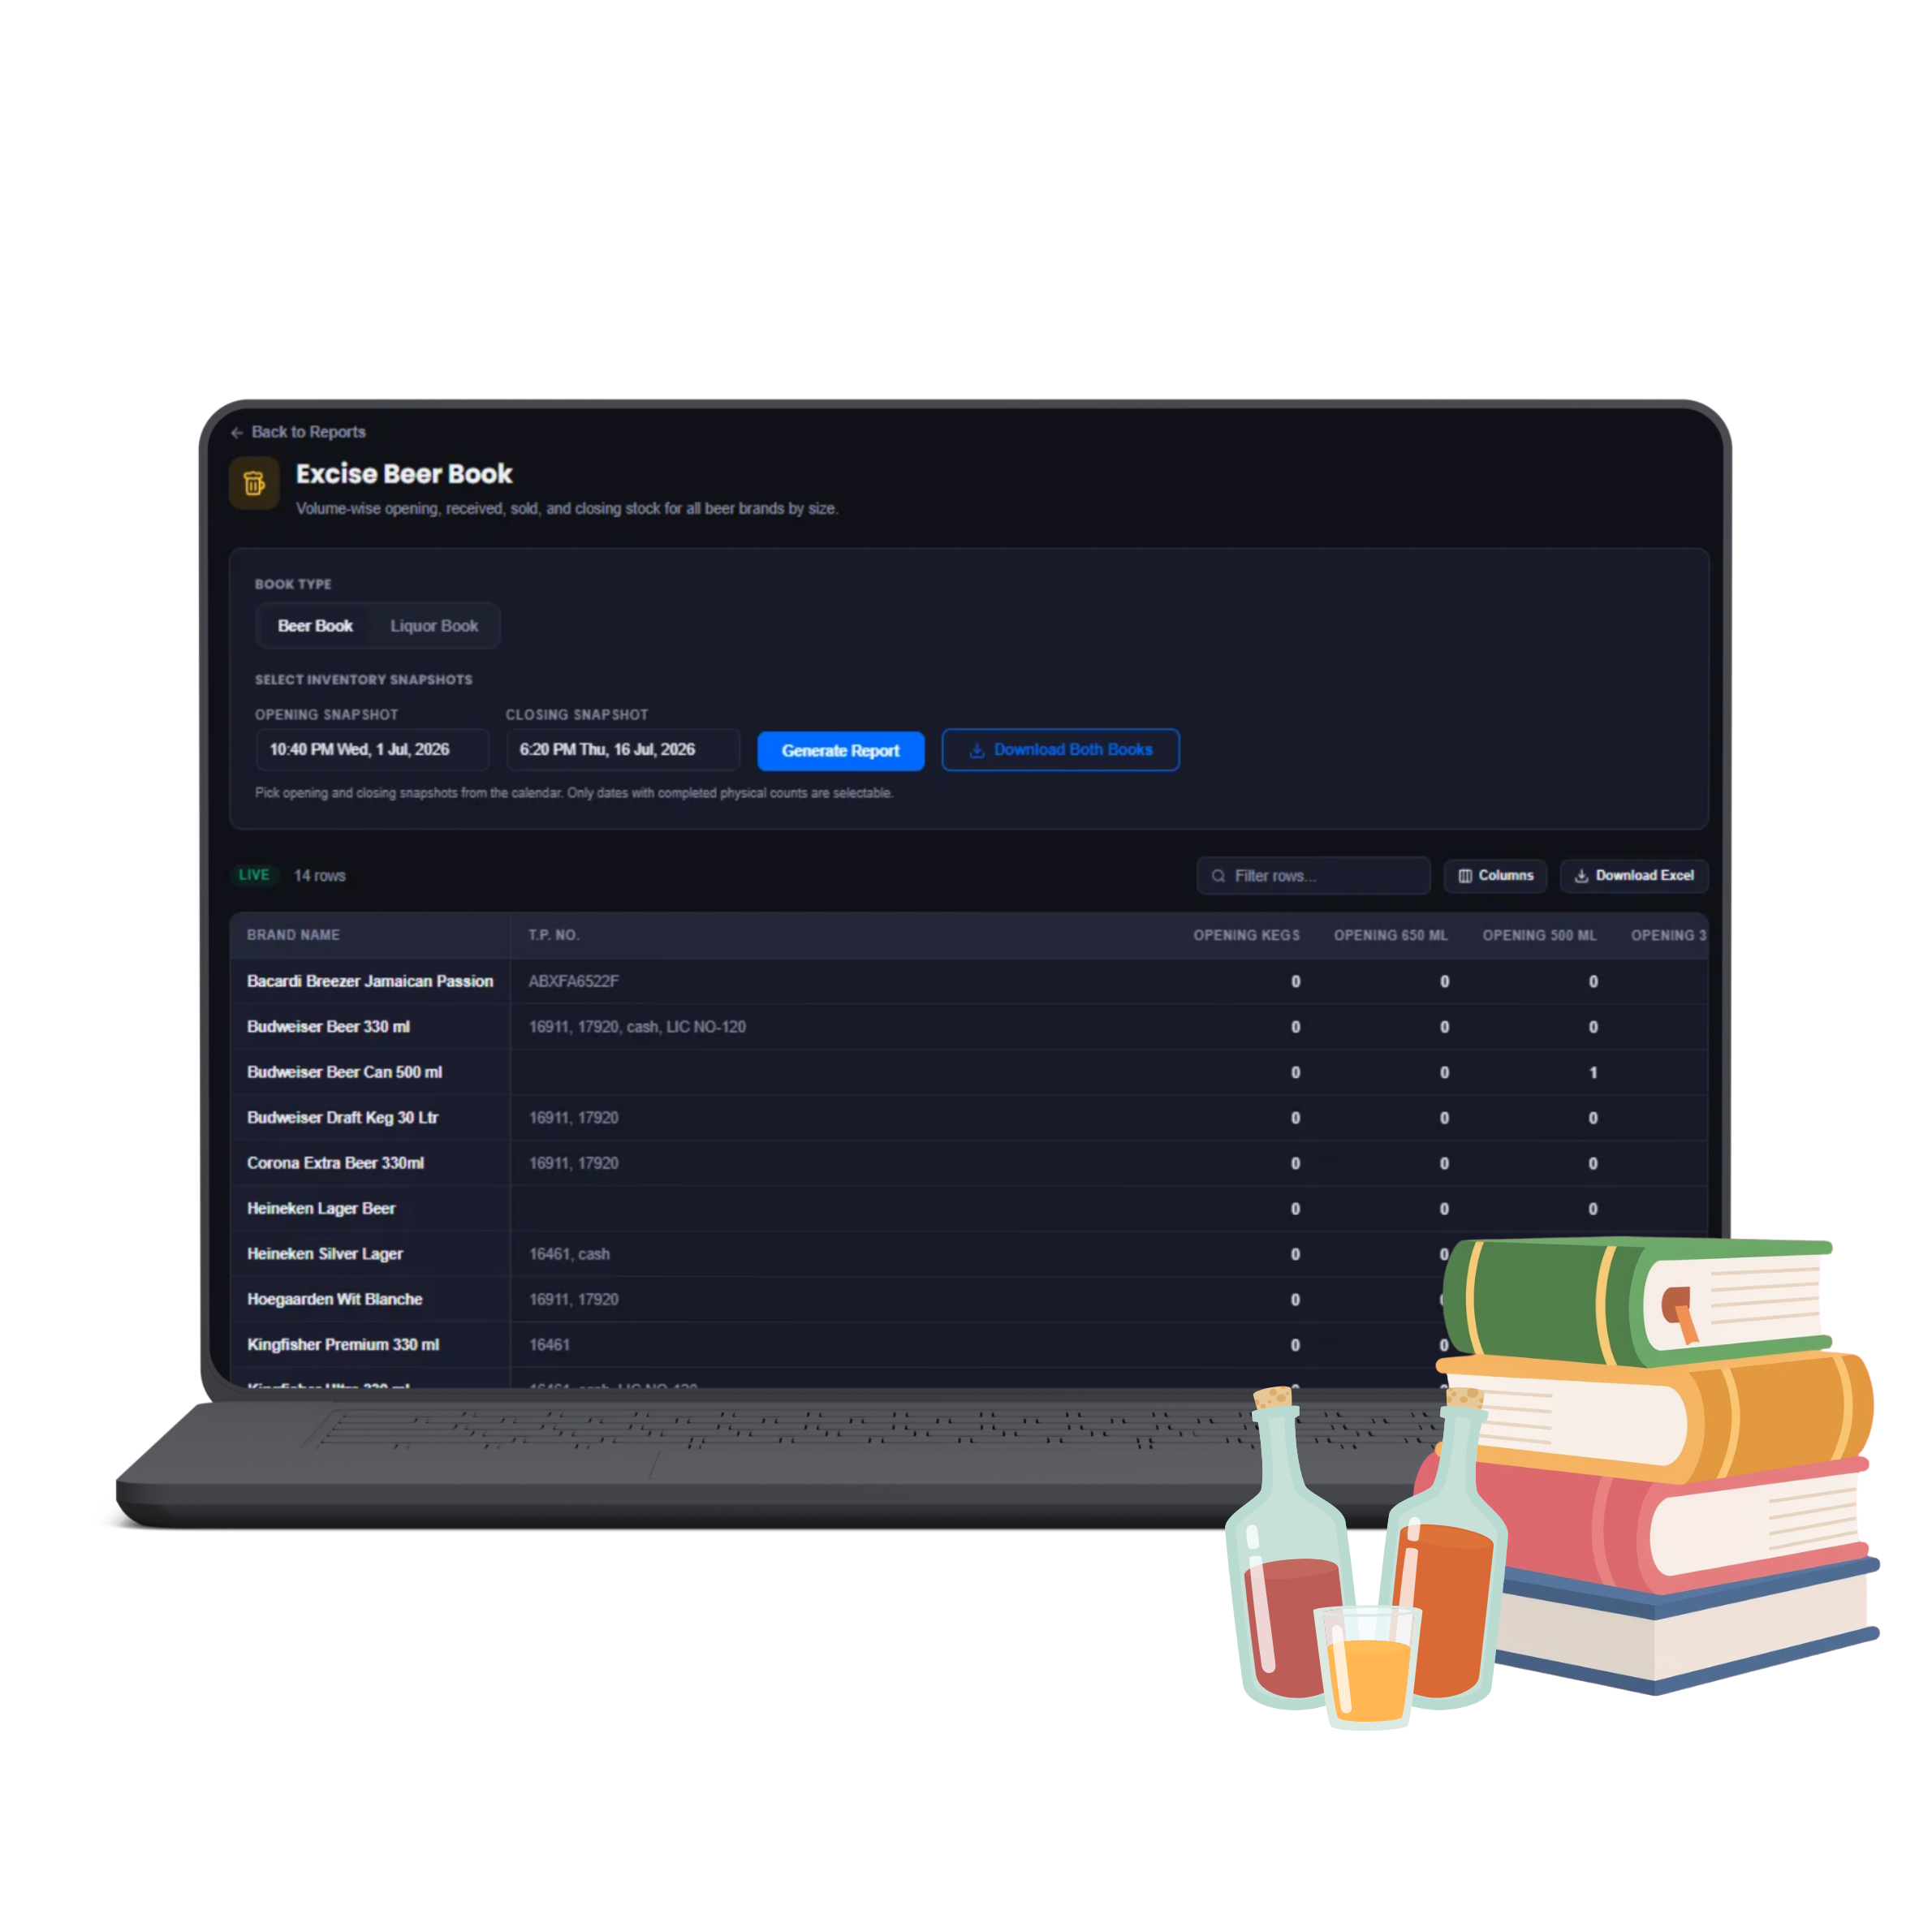
Built specifically for India's liquor excise compliance requirements, not a generic report retrofitted for it. Liquor licensing is a real regulatory exposure for a licensed bar; this turns compliance into a report that's generated, not assembled by hand every time an inspector asks.
Any report can land in an owner's or GM's inbox automatically on a schedule, no one has to remember to run it. The best report is worthless if no one opens the portal to check it; scheduling makes visibility automatic instead of dependent on someone remembering to log in.

Same stocktake, recipe and sales data, no extra setup, no separate reconciliation step.
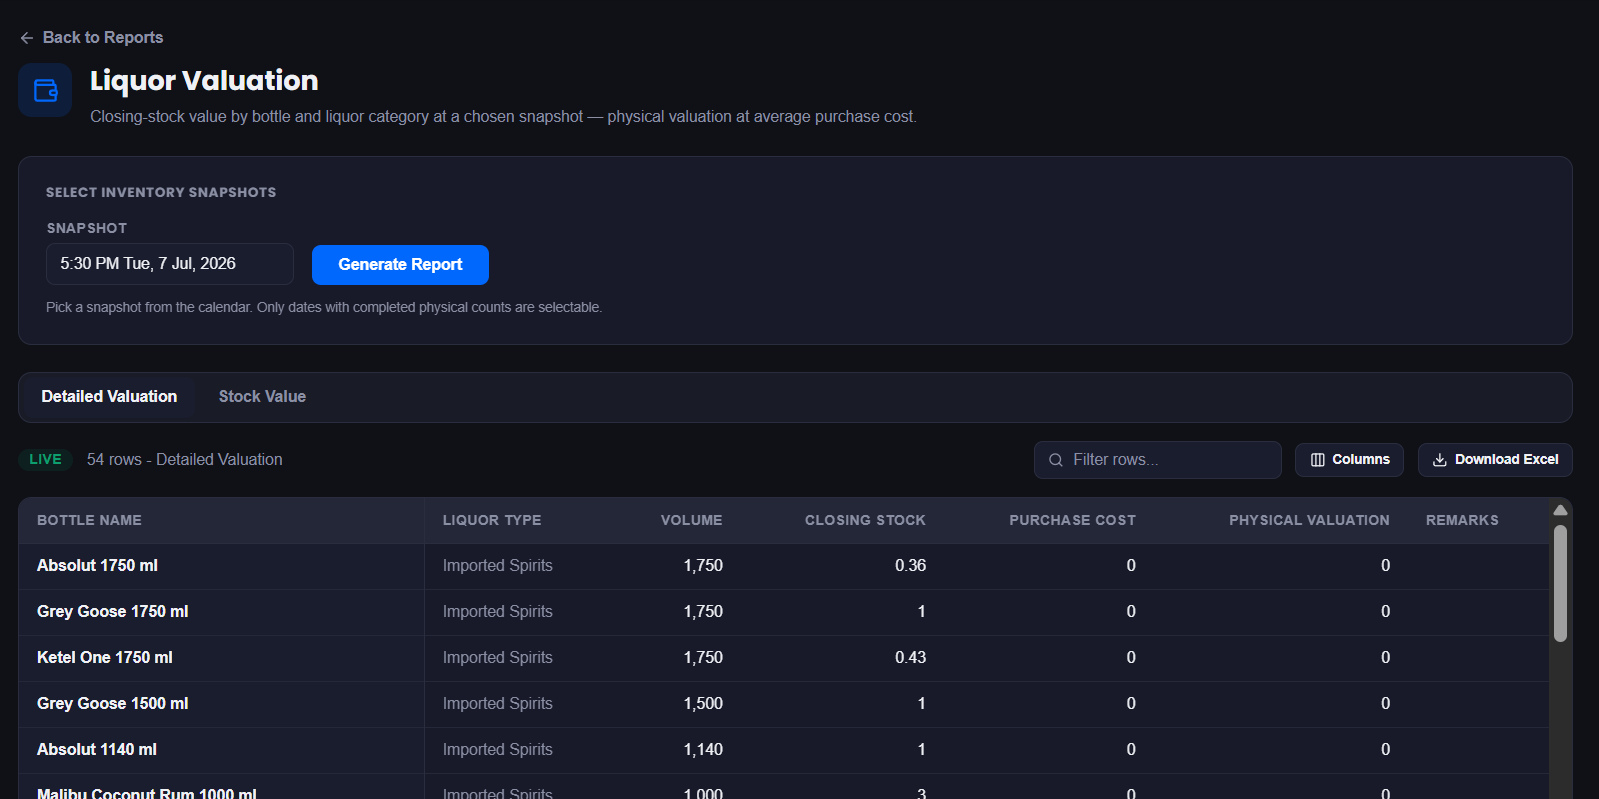
Puts a current cash value on everything sitting on your shelves right now.
Stock is money that hasn't been sold yet, this tells you exactly how much cash is tied up on the shelf at any moment.
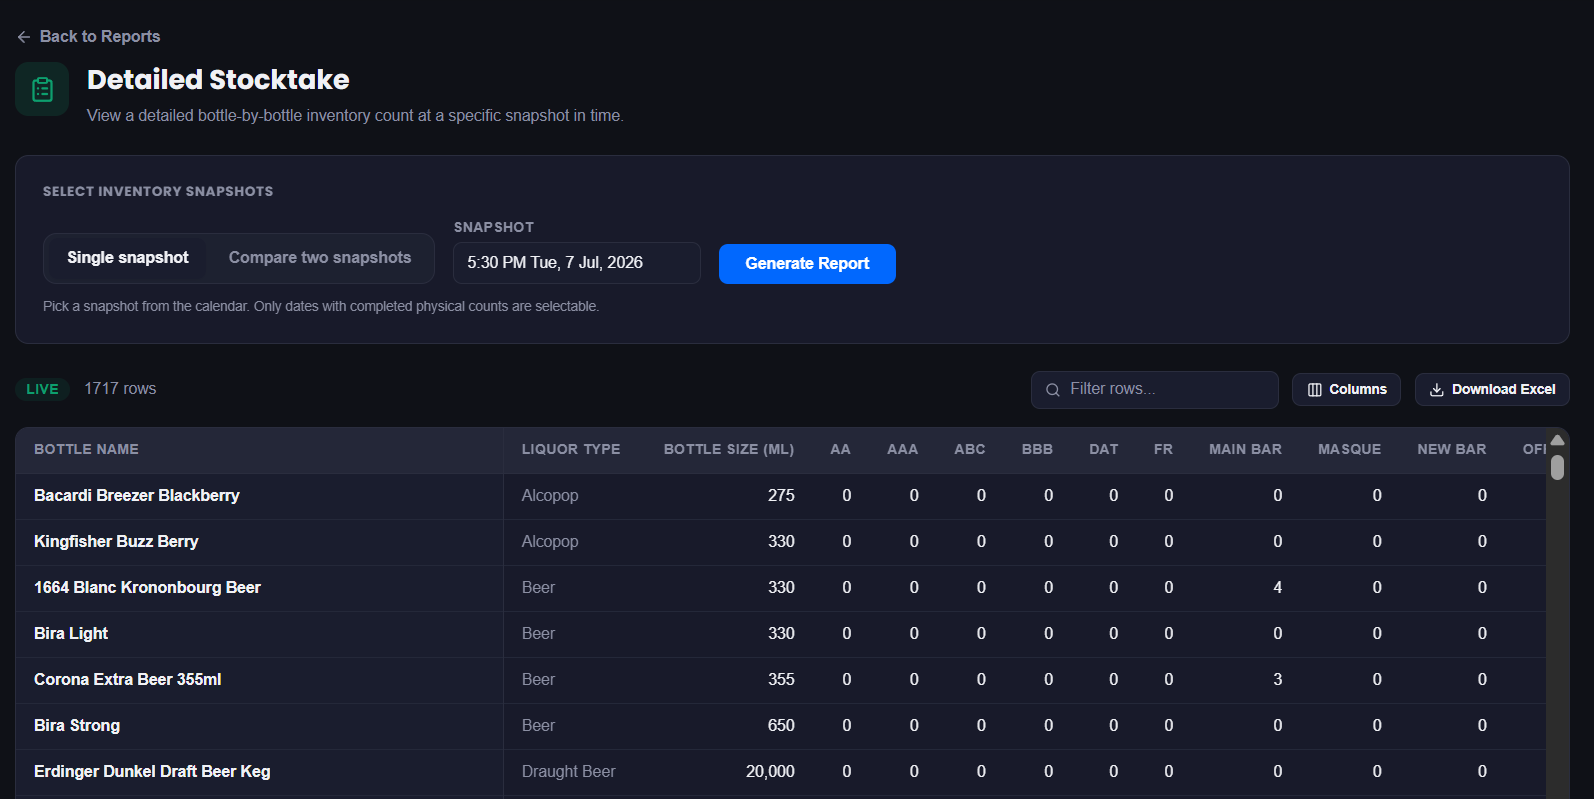
The raw, bottle-by-bottle result of any snapshot: quantities and values, side by side.
It's your audit trail. If a number in any other report looks wrong, this is where you go to check the underlying count.
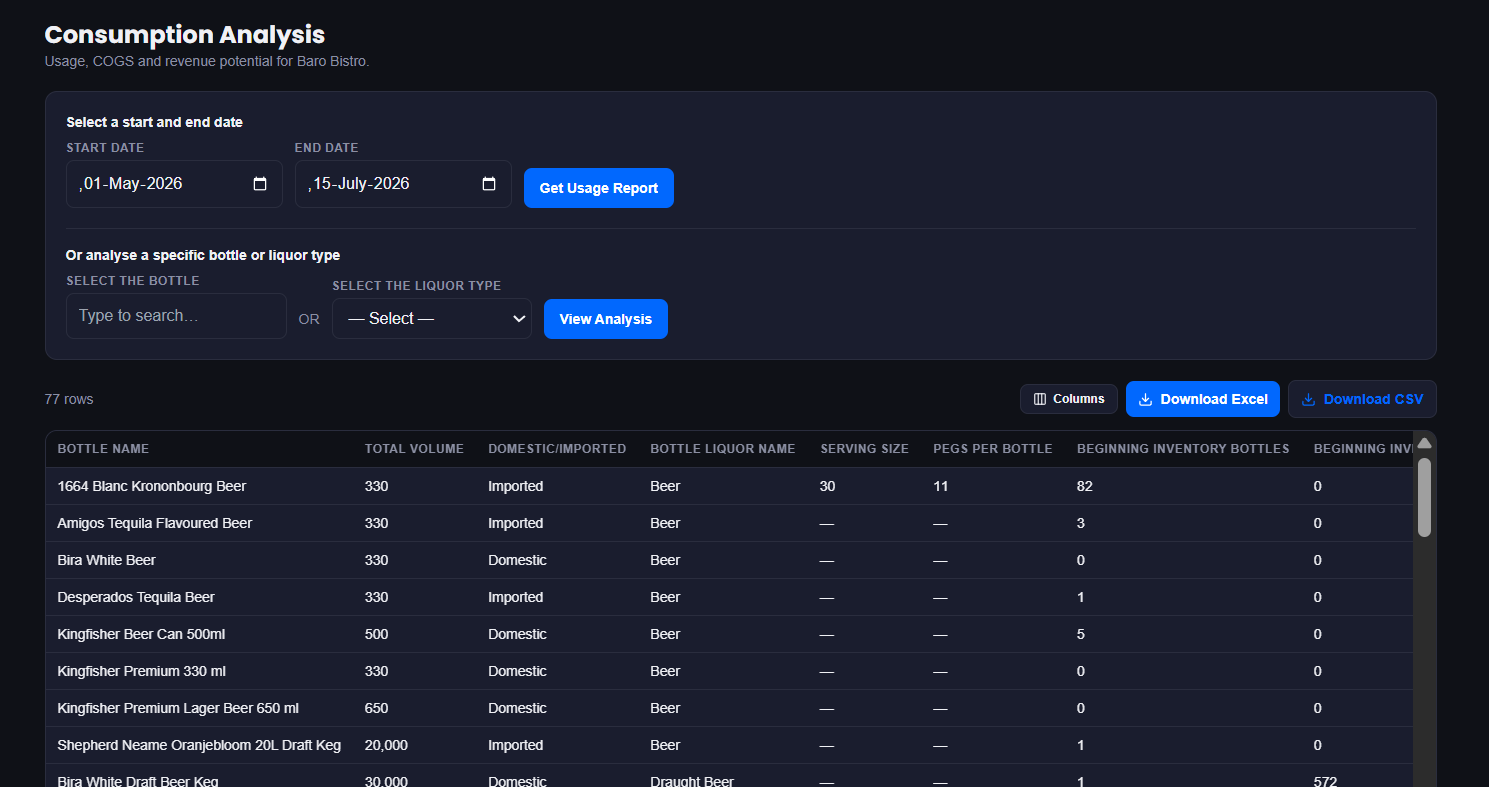
Tracks how fast each bottle is actually being used over time, by category or by item.
This is the real basis for setting accurate par levels and catching sudden usage spikes early.
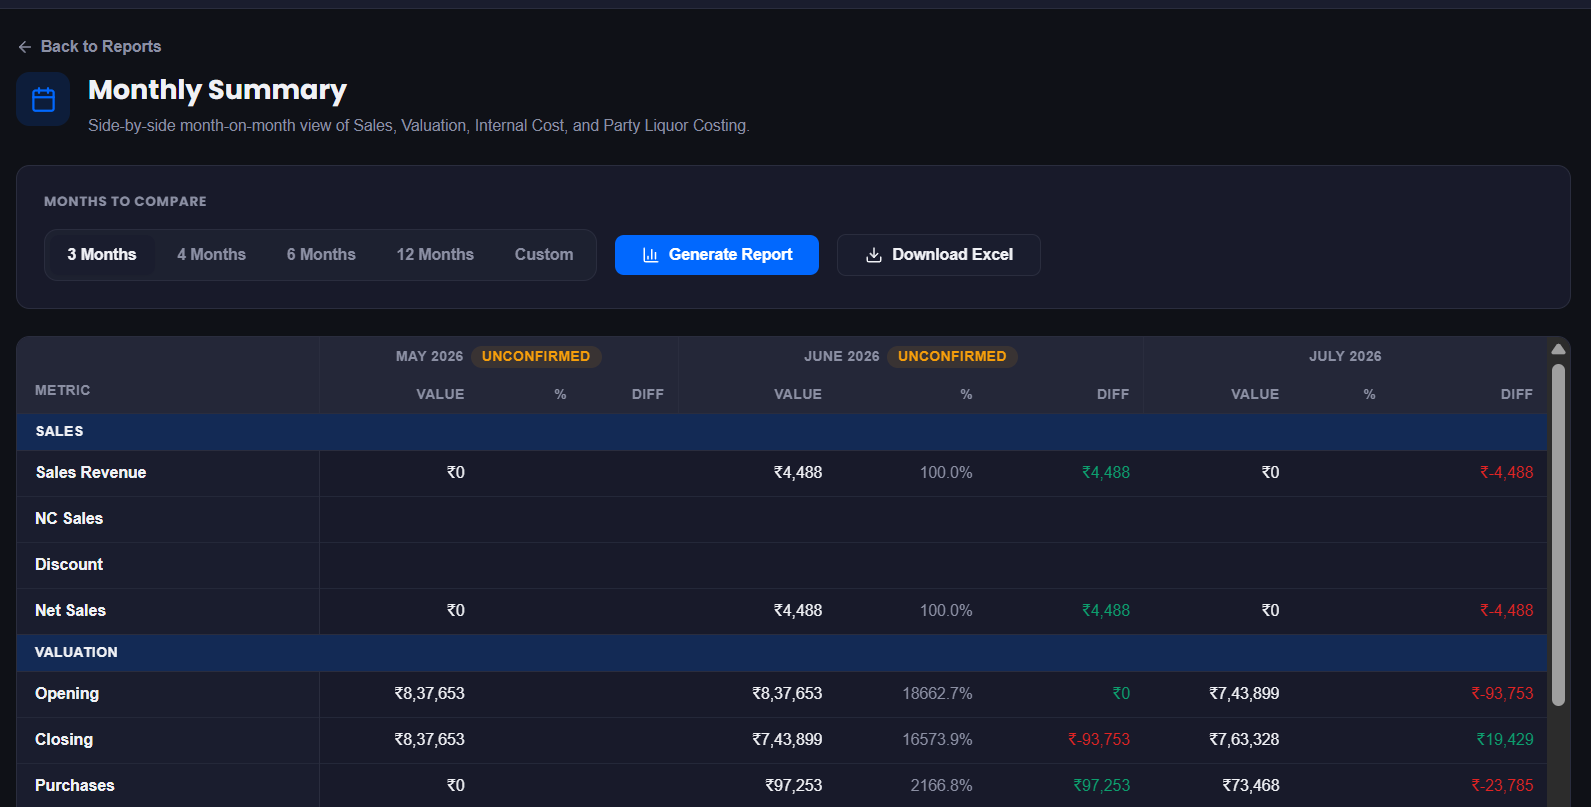
Rolls up cost, sales and variance into one month-level view for owners who don't want to dig into daily detail.
A fast, honest health-check: is this month better or worse than last, and by how much.
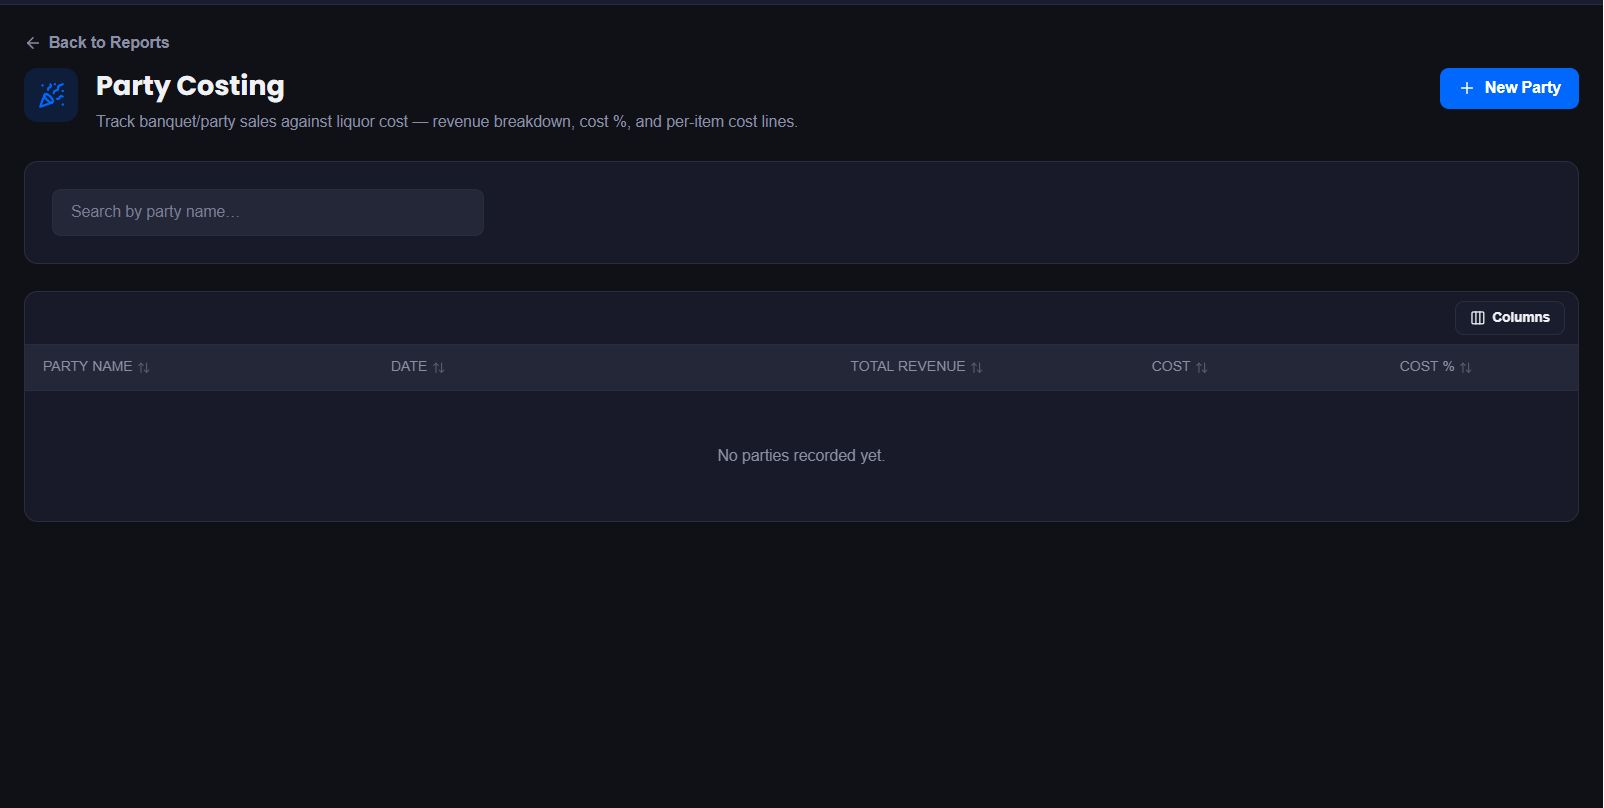
Costs out a specific event or private party's consumption separately from regular bar sales.
Private events often use house stock differently than according to the menu sales, this keeps that consumption from muddying your regular variance numbers.
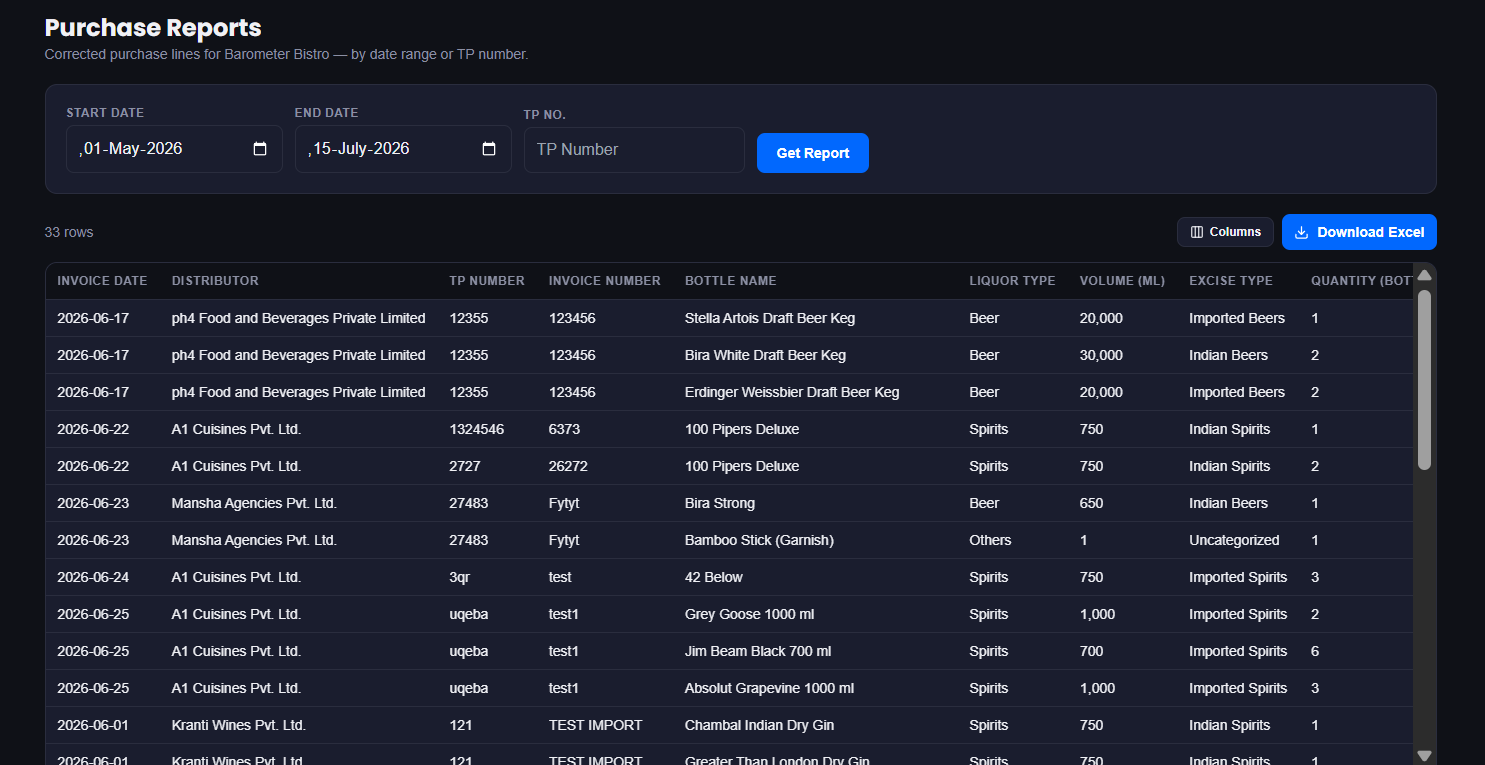
Every purchase order and bill, by distributor, category, or time period.
This is your buying history, essential for spotting price creep from a vendor or comparing distributor rates over time.
Spoilage and breakage aren't a separate report, they're logged through Bottle Adjustments and their effect shows up inside Variance, where it belongs.